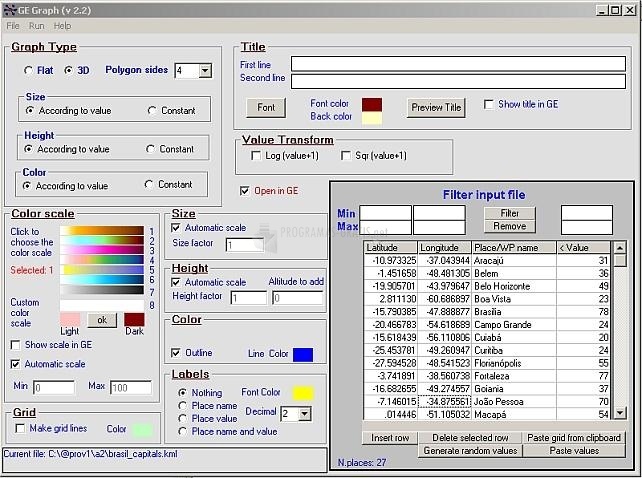

GE-Graph is a tool developed to generate graphics from KML files saved from Google Earth. The data, if preferred, can also be written directly into the application or pasted from another program. You can export the resulting file to Google Earth.
In the designs you create with GE-Graph you can insert geometric shapes (circles, squares, triangles, etc.), mark the area of each place, color certain places, scale, add annotation labels, paste texts from other programs ( Word, Excel, Access, etc.), export all chart data directly to MS Excel, sort and filter the brand data (by coordinates, name, values, etc.).
Once you generate the graph with GE-Graph, you can save it in KMZ format. It also has a viewer that allows you to read polynomials in KML, draw bars, reorder the sequence of coordinates if necessary, and so on. It is compatible with Google Earth 5.0.

You can free download GE-Graph 32, 64 bit and safe install the latest trial or new full version for Windows 10 from the official site.