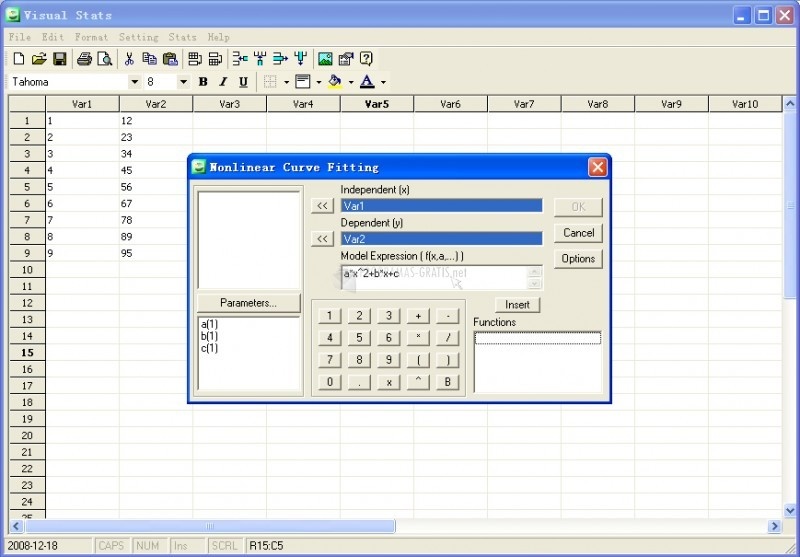

If for your work or studies you need to perform statistical analysis, it is best to have a tool that helps you in this task. On this occasion, we present Visual Stats, a professional and very practical spreadsheet that has been created and designed specifically so that the user can perform all kinds of statistical analysis of multiple variables on its interface.
From Visual Stats you can calculate density functions, discordant calculations, frequency analysis, correlation between variables and comparatives between different data and between several means obtained, linear regression analysis, trend analysis, factor analysis or perform non-parametric tests and much more. To complete its functions, Visual Stats offers us the possibility of graphing nonlinear curves through the data obtained. Therefore, Visual Stats, is designed for users who in their daily work need to perform statistical calculations of this nature.
Despite having a graphical interface only available in English, after downloading and installing Visual Stats on your computer, you will verify that its operation is quite simple. If you are obliged to perform statistical analysis, do not miss the opportunity to download this free trial version of Visual Stats.

You can free download Visual Stats 32, 64 bit and safe install the latest trial or new full version for Windows 10 from the official site.